
There are thousands of various indicators of technical analysis, but if we want to look at just the main tools, we can literally count them on our fingers. The main tool is the Moving Average and it serves as the basis of the overwhelming majority of other indicators, including both trend ones and oscillators as well. In this article we will consider this tool from the point of view of theory and practice.
The principle of averaging
The simplest indicator is the SMA (Simple Moving Average). Its formula is as simple as possible and every student is probably familiar with it. It is used to find the arithmetic mean value. For example, if one candle has a closing price of 88, the other is 97, and the third is 94, then the average value of the line will be 93. That is how the SMA works. More complex Moving Averages are based on the same formula, but with some modifications.
Types of Moving Average
There are about 10 popular varieties, of which we will consider the 5 most widely used tools. In fact, there are significantly more of them, but the lesser-known options are of interest to only a narrow circle of traders, so we will not pay attention to them.

The picture above clearly illustrates the differences between different types of MAs. The averaging period of all the lines is the same – 50. As you can see, the SMA has the greatest inertia, and the TSMA has the least.
SMA. A simple type of line that uses the usual averaging formula. We examined it in detail in the paragraph above.
EMA. It differs from the SMA in its having exponents in the calculation formula. It’s similar in many ways, but it is very sensitive.
TMA. The Triangular Moving Average, which has a double smoothing of total values. Due to this, it has a wave-like shape and is unable to make sharp angular turns, even when there’s high market volatility and a short period. One of the most effective tools for recognizing wave periods on a chart.
TSMA. The averaging formula with an added time scale, where the importance of each price bar is weighted in descending order. The first is the most important, the last is the least important. This makes the curve more responsive to rapid changes in the situation on the chart; it is less inertial than SMA, EMA and TMA.
HMA. The brainchild of Alan Hull, a trader from Australia who tried to make a perfect tool devoid of the main drawbacks of other types of MA – lag and low accuracy on small periods. He managed to get quite close to his goal. Under conditions of high volatility on the market, the HMA does indeed largely outperform the usual types of Moving Average.
In addition to these options, there are also the WMA (weighted), TEMA (double exponential), VMA (vidya formula), and other fairly popular options. The range on the Binomo terminal includes 11 options. In addition to 14 other indicators, it provides great potential on the platform in terms of technical analysis.
Trading on the Moving Average
The Moving Average formula eliminates insignificant price fluctuations, thus revealing the real situation on the market. Therefore, in capable hands this tool is very powerful. There are 4 main approaches to interpreting MA signals.
Intersection with the price – the position of the line relative to candlestick formations on the chart, contact with it and a breakdown.
The intersection of 2 or more lines is the second main reversal signal, on the basis of which most indicator analysis strategies are created.
The distance between several curves – an increase in deviation indicates an increase in volatility, a narrowing of the channel signals a transition of the market to the flat stage.
Divergence and convergence – the formation of 2 or more extremes, showing that the market is moving in one direction and the indicator is moving in the opposite direction.
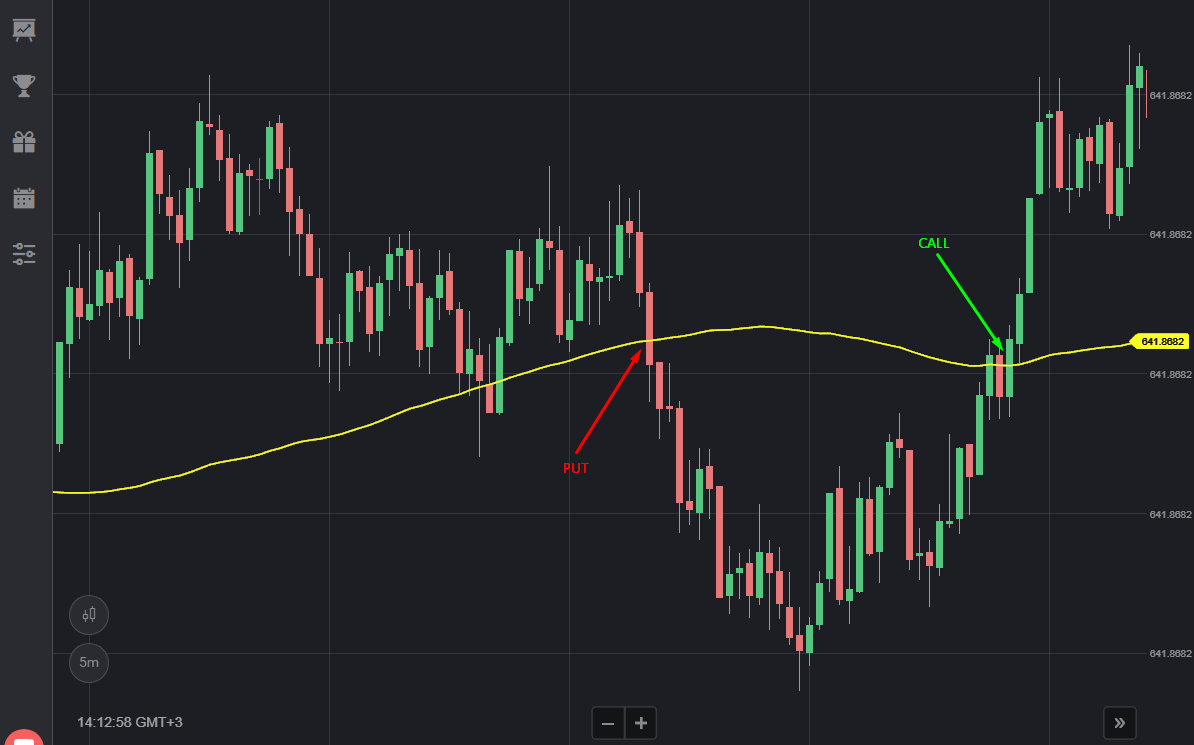
This picture clearly illustrates the main reversal signal in the form of the intersection of the SMA with the price chart. In addition to the point of contact, the prior deviation factor of the MA from the price also plays a role.

There is also another approach when using 2 or more lines, which is illustrated in the picture above. It uses two Welles Wilder Moving Averages (SMMA) with periods of 50 and 25.
Conclusion
Bollinger Bands, Alligator, MACD, and many other indicators are based on a combination of Moving Average curves with different parameters. You can customize not only the period and type of averaging, but also the size of the indentation, the registering point (closing/opening and minimum/maximum candle), and the shift. For example, the legendary Alligator from Bill Williams is nothing more than a combination of 3 SMAs with different periods and shifts.


