
The MACD is a trend indicator and the RSI is an oscillator. We can say that these two indicators are the brightest examples of their types. This combination of trend instrument and oscillator is a successful one: when used together, there is a significant increase in the accuracy of the signals. In this article, we will look at the difference between oscillators and trend indicators, as well as review a trading strategy using the MACD and RSI.
Overview of the indicators
This strategy is based on 2 indicators – a trend one and an oscillator. What is the difference and what criteria are used to classify them? The delineation is rather thin. It is believed that trend indicators simply indicate the direction of price movement. When using them it’s difficult to determine the probability of a market reversal at a specific point in time. Vivid examples of trend indicators are the Moving Average, Bollinger Bands, and Alligator.
Oscillators have oversold and overbought zones located at the top and bottom of the window. This type of indicator is not superimposed directly on the chart, instead it is built in a separate window. Typical oscillators include the RSI, Stochastic, and CCI. Based on this classification, we can conclude that the MACD is something in between. It is based on the Moving Average trend indicator. However, in addition to trends, the final product can also differentiate overbought and oversold periods. Nevertheless, traders usually consider it a trend instrument.
The MACD consists of two Moving Average lines and a histogram that clearly shows the distance between the curves. The intersection of the lines is a trend indicator’s signal. The position of the curves with respect to the N/A boundary is the oscillator’s signal. The higher the position of the MACD lines, the higher the probability of an uptrend reversal. And the lower they are, the more likely it is that active downward movement will reverse.
The RSI is a simple yet effective one-line oscillator. By default, there are two zones that are at the levels of 20 and 80. The interpretation of its signals is standard, the same as for the MACD. In this strategy, the parameters of the indicators are modified so that the border of both zones is at the same level – in the middle of the RSI window at level 50.
Setting up the Binomo terminal
The functionality of the Binomo platform makes it possible to customize not only the period of the indicators, but also their appearance. The possibilities are quite extensive. There are also some hidden features, like integrating two indicators. But this strategy uses a usual combination of two tools.

Setting up the terminal:
- Choose a highly profitable asset. They will be at the top of the list.
- Set the candlestick mode of the chart and set the interval to 15 seconds.
- Add the MACD indicator, keeping its standard settings.
- Add the RSI indicator, reducing its period to 10 and setting the position of both zones to level 50.
- Pre-set the amount of investment, because after the signal is formed you’ll need to open the trade immediately.
If you like, you can also customize the color of the fill areas. Oversold is red, overbought is green. These are the standard colors to indicate rising and falling prices. The trader’s reaction rate is important in short-term trading, so these kinds of things should not be neglected.
Strategy signals
The main signal of the MACD is convergence of the Moving Averages and their intersection. The RSI has one curve, so the trader should monitor its point of intersection with the zone boundary, which is at level 50. Market entry is a simultaneous signal from both indicators. Acceptable deviation is no more than 3 candles. If the signal from one instrument is not confirmed for a long time by the second one, then it should be ignored.
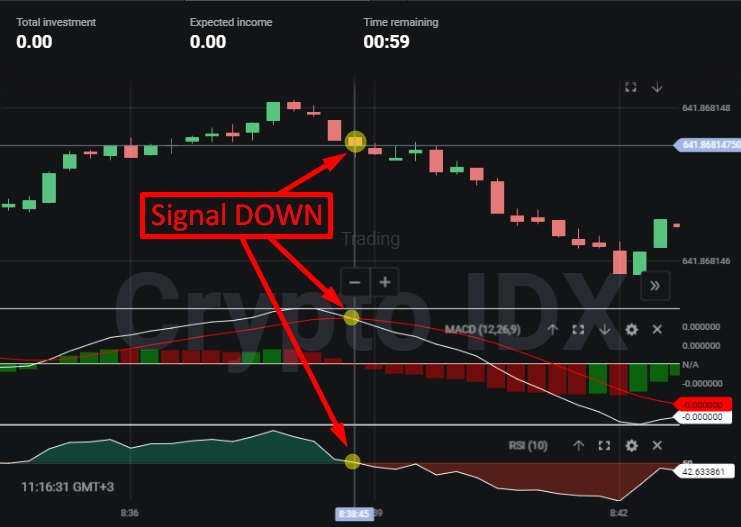
Signal for a decrease. This is possible only when both MACD lines are in the upper position – above the N/A boundary. This indicates an active uptrend. The MACD reversal signal is the intersection of the curves with the exit of the red line above the white one. Confirmation from the RSI is an upper breakdown of level 50, the transition of the curve into the lower area of the indicator window.

Signal for an increase. A prerequisite is an oversold MACD – its lines must be below the N/A border, and the RSI must be below 50. The signal is movement of the lines upward and the subsequent crossing of the middle borders. To make it easier, you don’t have to monitor the MACD lines, just the position of the histogram. The nature of its movement is very similar to the RSI oscillator, but it does not copy it exactly.
“In conclusion, we’d like to note that investing more than 5% of your balance in a single trade is strongly discouraged, as this significantly increases the level of risk. According to the rules of capital management, the optimal amount of investment is less than 1% of the account balance.”


