Fractal indicators play a vital role in technical analysis, providing traders with unique opportunities to forecast market movements. One particularly useful tool that combines these principles with specific elements of trend analysis is the Fractal Chaos Bands.
The indicator discussed below helps traders better understand market cycles and volatility, making it virtually indispensable for binary options trading. Surprisingly, however, many traders remain unfamiliar with this tool, missing out on the opportunity to trade digital contracts more effectively.
Indicator Description and Core Mechanics
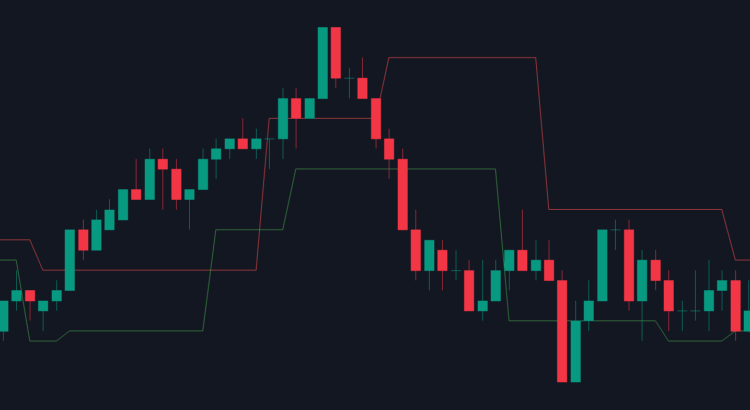
Fractal Chaos Bands is a tool based on fractal theory, which describes complex systems and chaotic market processes. The indicator plots bands on the price chart that reflect trend dynamics. Visually, it resembles the widely known Bollinger Bands, but the underlying calculation formula is entirely different.
It is rooted in the concept that market movements, much like many natural phenomena, possess fractal characteristics—meaning that certain structures repeat over a given period.
Visually, the Fractal Chaos Bands consist of three lines or bands. Two of them bound the price range, essentially forming a price channel, while the third divides the range exactly in half. The width between the bands varies depending on volatility: during strong movements, the market becomes more “chaotic,” and the bands expand; during periods of calm, they contract, signaling price stability.

It is worth noting that FCB can be used both to determine the direction of the primary trend and to identify entry signals for a trade. The core of interacting with this tool lies in observing price behavior relative to the bands:
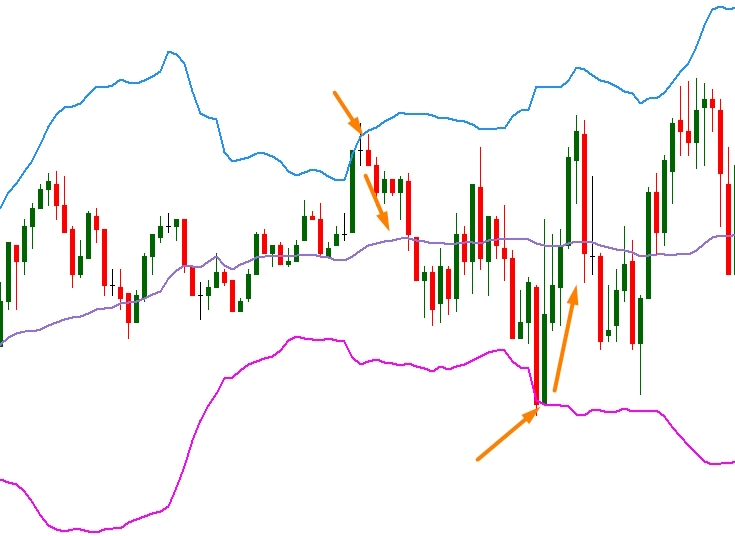
- Upper Band: When the price approaches the upper boundary, it may indicate that the uptrend is likely to slow down or even reverse. If the price crosses the upper boundary, it can serve as a signal to open a PUT option.
- Lower Band: When the price drops to the lower boundary, the market may be oversold, making an upward bounce highly possible. A break below the lower band can signal an opportunity to open a CALL option.
Regarding the indicator settings, most professionals recommend keeping them at their default values, regardless of the timeframe you are trading on.
Strategies for Using Fractal Chaos Bands in Binary Options Trading
Overall, there are two primary approaches to applying this indicator in digital contract trading:
- Trading Band Breakouts: One of the most common strategies is trading the crossover of the channel’s upper or lower boundaries. When the price breaks through the upper line, a PUT option is opened; conversely, when it crosses the lower line, a CALL option is placed.
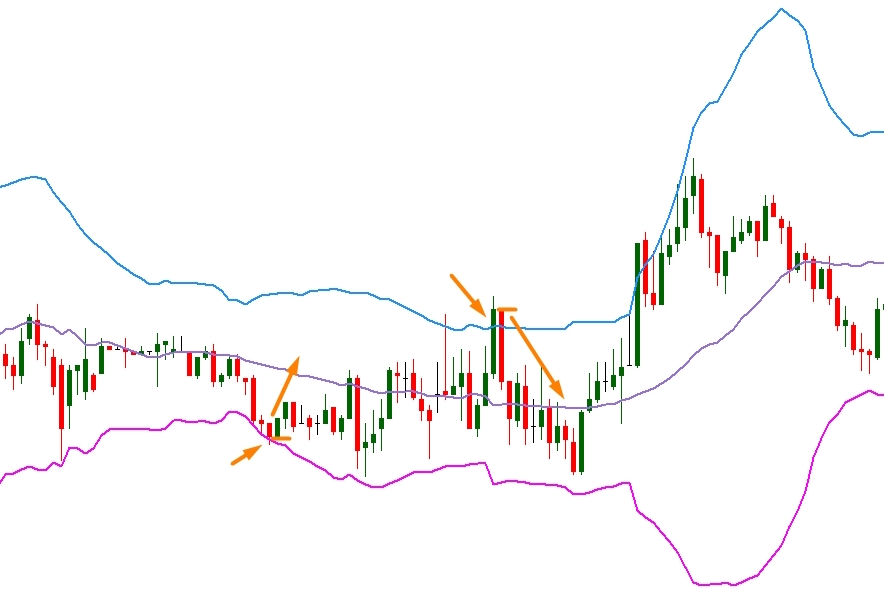
- Trading Bounces: When the price approaches the extreme lines of the channel, it may signal a potential trend reversal. Bounce trading involves opening positions in the opposite direction.
In conclusion, it is safe to say that Fractal Chaos Bands is a powerful indicator that can become a highly valuable tool in any binary options trader’s arsenal. Its fractal nature allows for a deeper understanding of chaotic market behavior, and when combined with other technical analysis tools, it helps pinpoint the optimal moment to enter a trade with greater accuracy.
Caution! This article is not intended to be investment advice. No strategy can guarantee 100% correct trading results. A successful trading result in the past is not a guarantee that it will be repeated in the future. Any information contained in this article is for informational purposes only.